How to build your own financial dashboard
Learn about Streamlined Finance most powerful functionality: to create and customize your own dashboards.
In most finance websites you are forced to see what they have decided to show you, which means that you see a bunch of stuff (including ads) that are not relevant to you. Often, you have to click around, switch back and forth to get the insights that you want.
With Streamlined you can choose what you want to see, put stuff together and really get the financial overview that you desire.
Watch the video
Enter your first dashboard
Upon entering Streamlined, the first thing that you will see is that you can create a custom dashboard or start from one of three pre-composed templates.
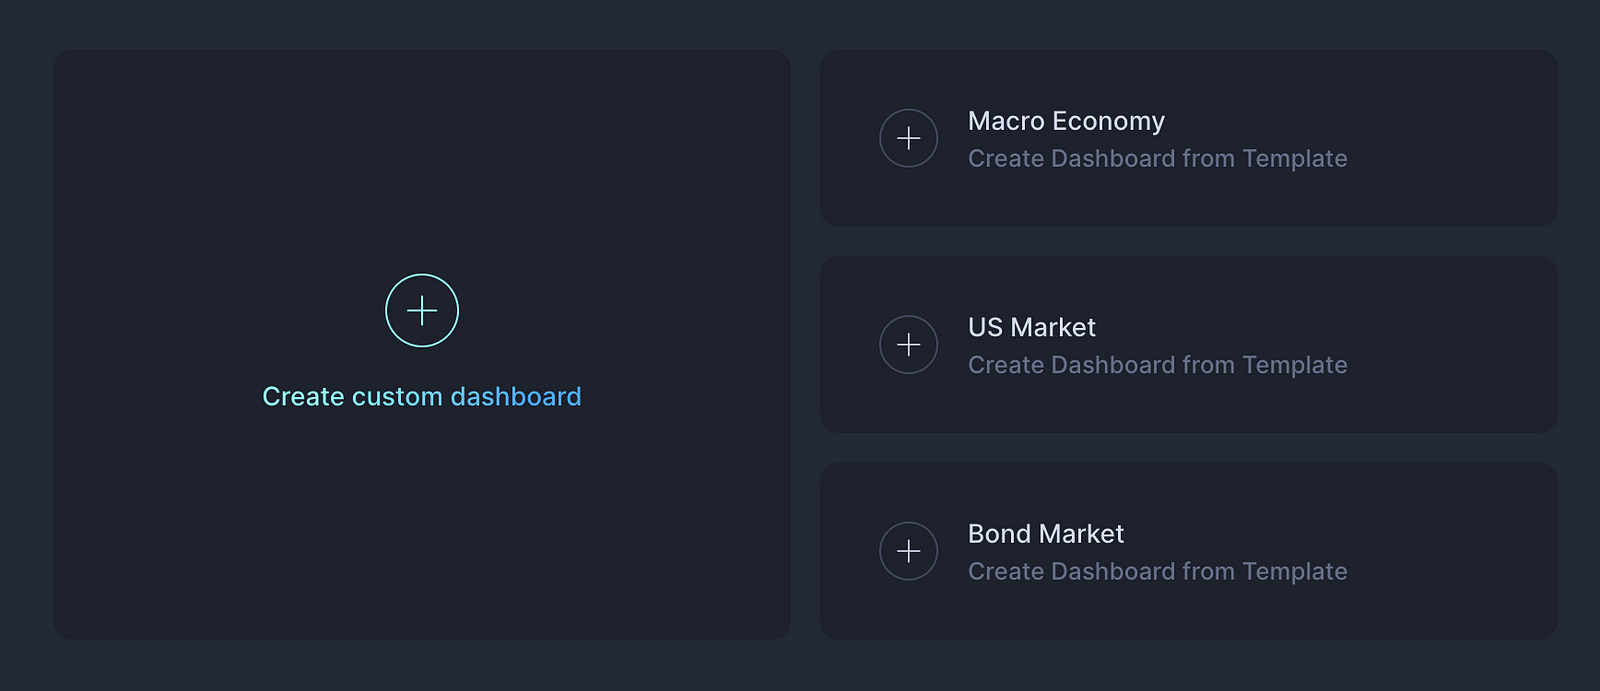
In this guide, we’ll start with a custom dashboard and explain the basics of creating a custom dashboard.
Select Component
Once you have clicked on “Create custom dashboard”, you will then see an empty screen with just a “+” button.

Click on the type of component that you want to add (more on each component will be explained later).
Component Settings
After you have chosen your component, a dialog for the component’s settings will pop-up:

The settings dialog contains clickable tabs in the header that allows you to switch between the different options.
Datasets Tab
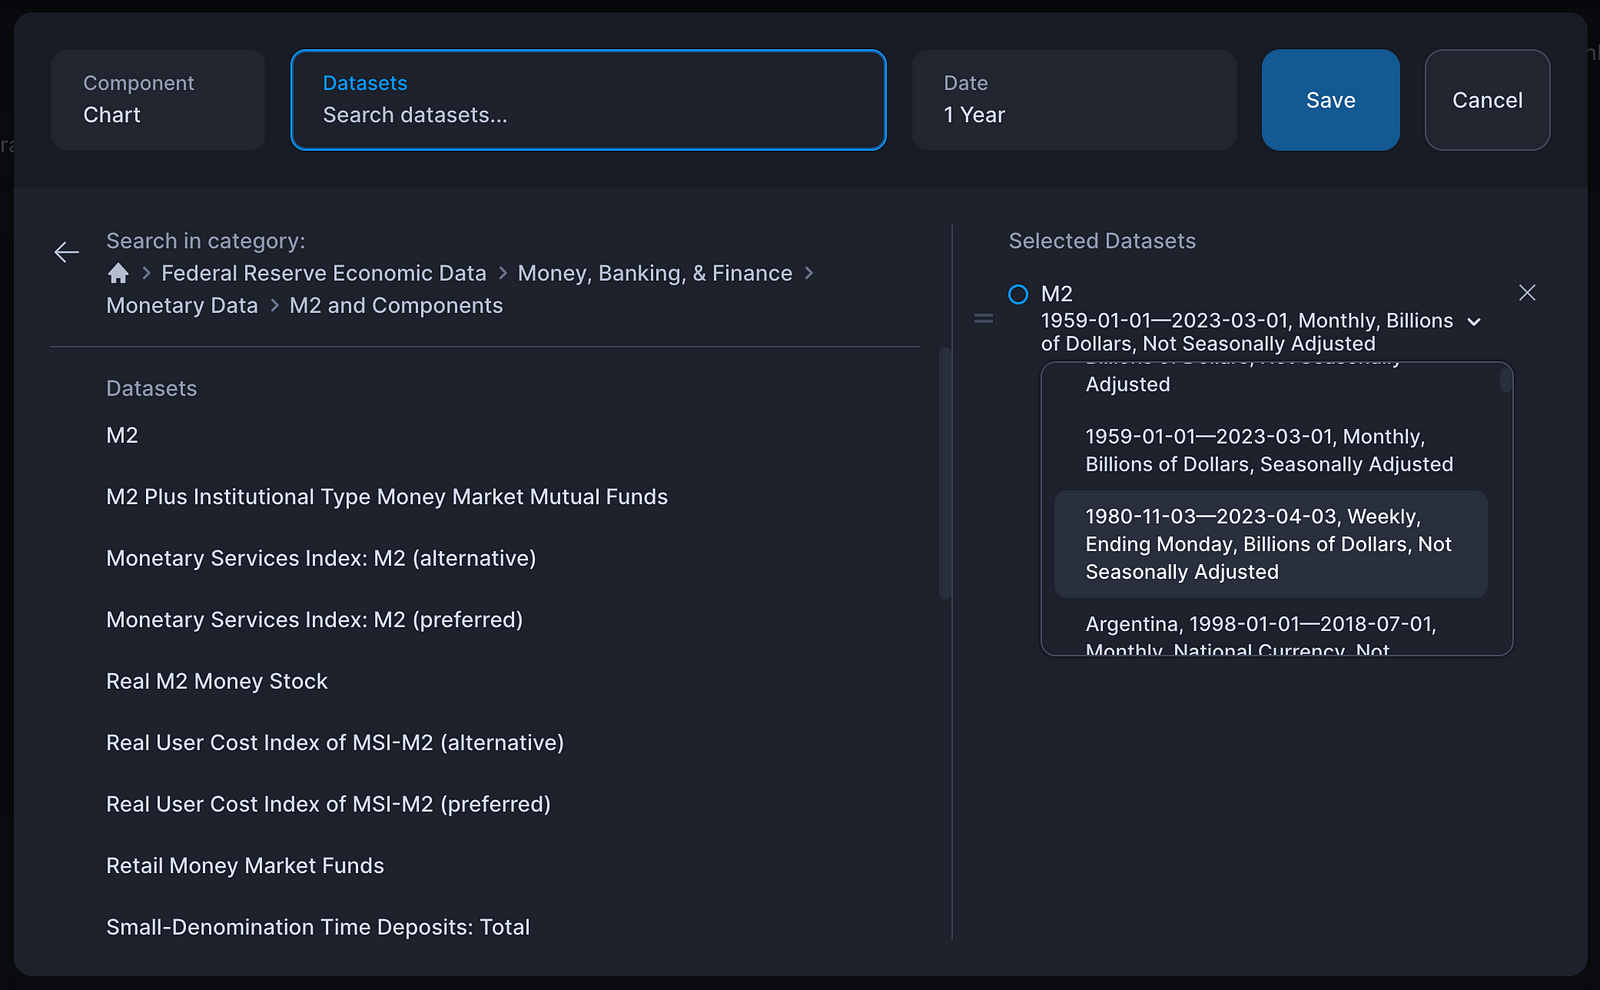
By default, you get prompted to select a dataset which you can add by clicking on the category and then the dataset.
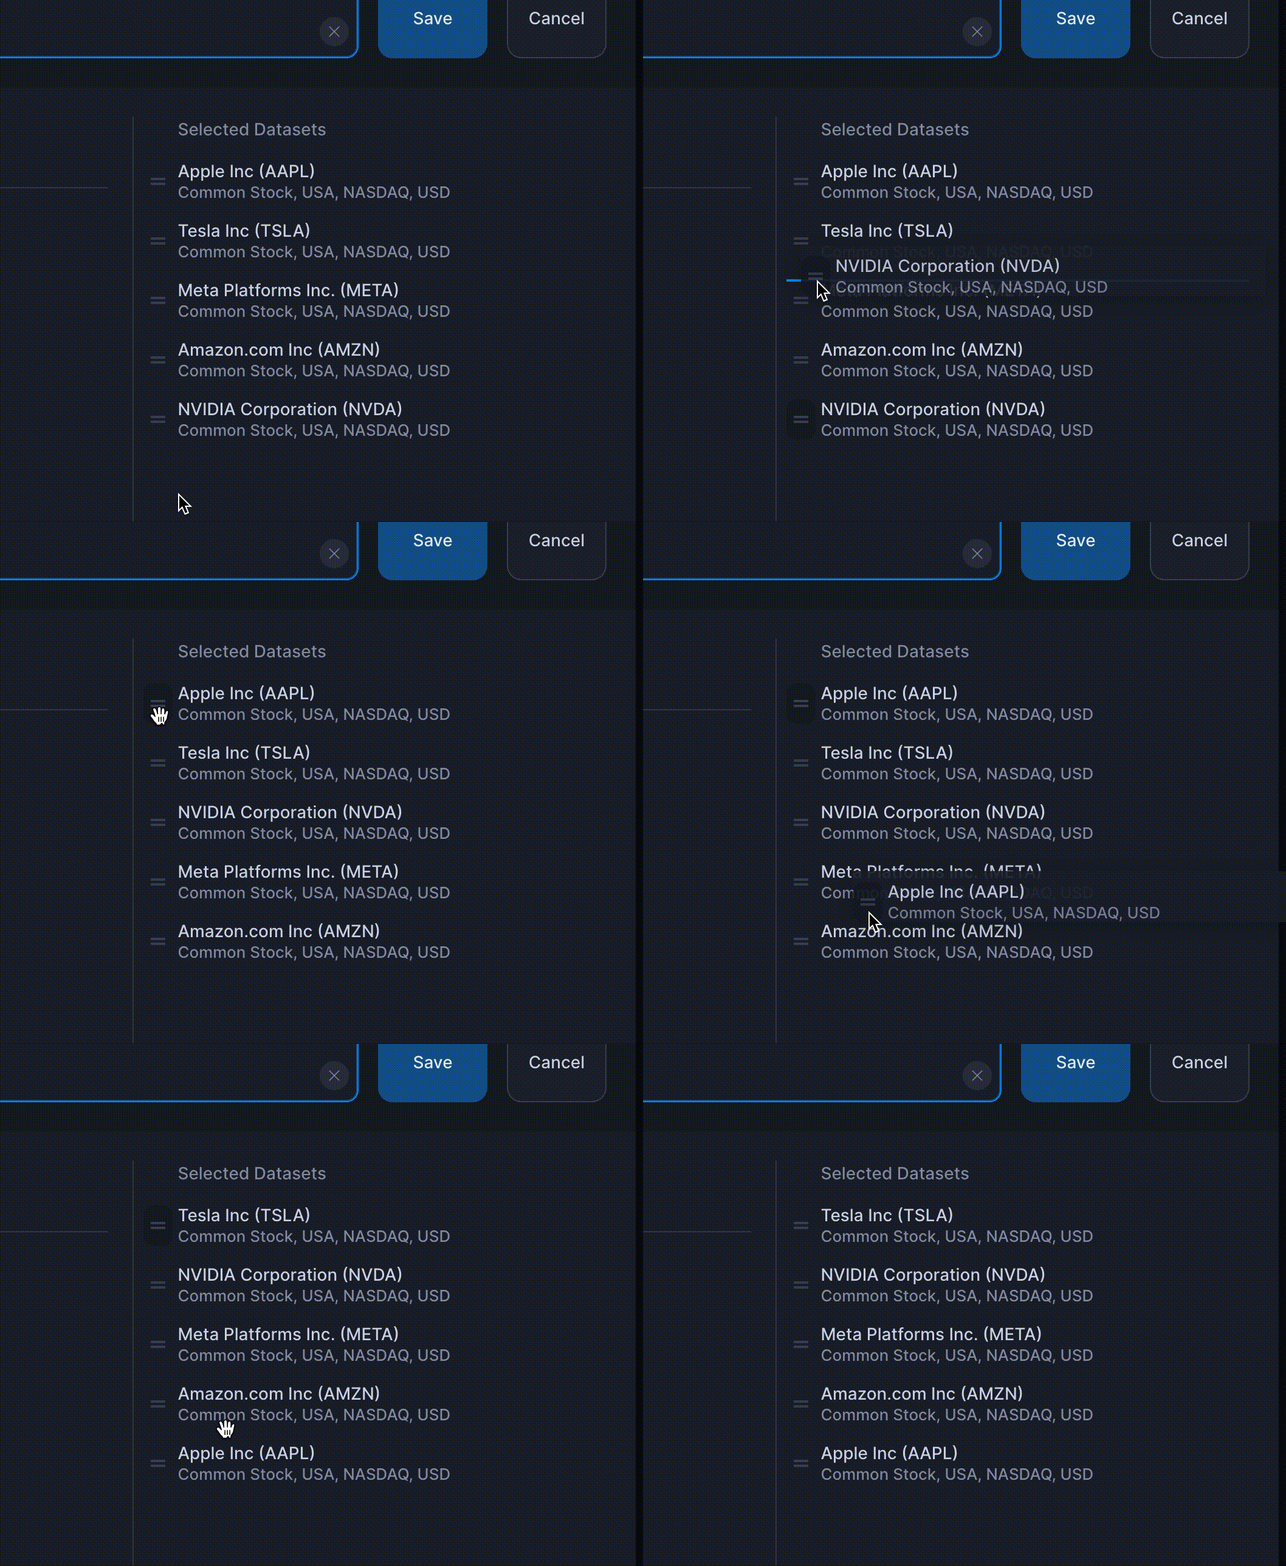
Additionally, you can move around the selected datasets and re-order them.
Component Tab
In the component tab, you can choose to change the component but also choose the component’s specific settings.
Except for the Realtime Chart/Candles Chart, all components will have an option to specify a title. This title will be the display title of the component of the dashboard, so it’s useful for naming and/or categorizing your components.

In addition, the screener component allows you to customize your columns and display exactly what you want to see.
Date Tab
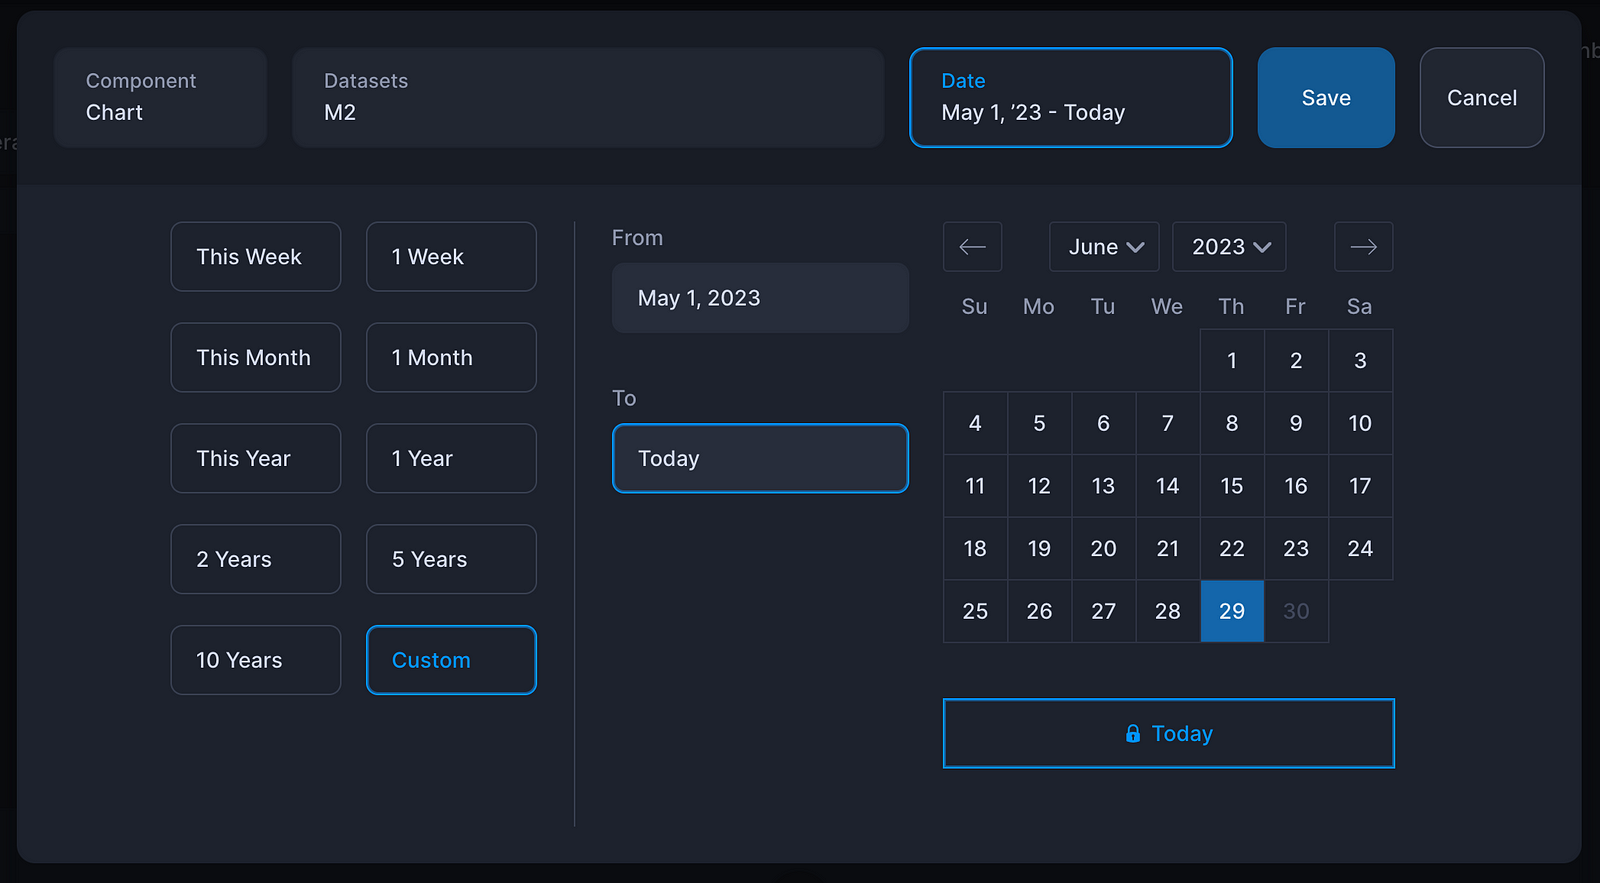
Then lastly, some components (Chart & Correlations) allow you to set a custom date range:
After you’re done customizing, press “Save” and the dialog will close and show your newly created component on your custom dashboard.
Adding a new component in this manner will automatically put your dashboard in the editing layout mode.
Editing the Layout
When you are editing the layout, components can be moved around, resized and removed.
- You can move components by just clicking and dragging them while moving your mouse.
- You can resize components by clicking in the bottom-right corner of a component.
- And lastly you can remove component by clicking on the “X” button in the top-right.

Once you are done, simply click on “Save Changes” in the header bar in the top.
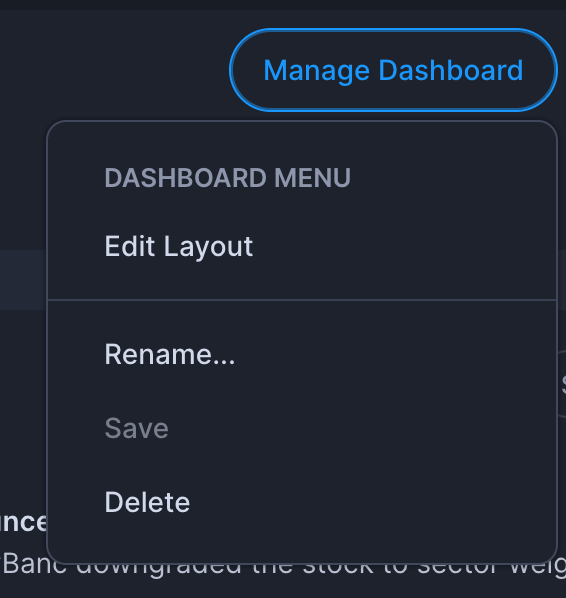
You can re-active the edit layout mode by clicking on “Manage Dashboard” -> “Edit Layout” and re-arrange your components again.
Manage dashboard
Once you have created your dashboard, you can manage your dashboard by clicking "Manage Dashboard" in the top header bar.
Here you can:
- Edit Layout - Set the dashboard in editing layout mode (to rearrange components)
- Rename - To rename the dashboard
- Delete - To delete the dashboard
Adding more dashboards
Streamlined gives you the power to add as many dashboard as your want to give you the best overview possible of the economy and financial markets.
